Manual data processing no longer holds back analytics teams. In 2026, AI-powered business intelligence platforms automate dataset cleaning, visualization, and SQL query generation in seconds. Here is a breakdown of the top 5 AI data analysis tools to help you choose the right fit for your tech stack.
Julius AI
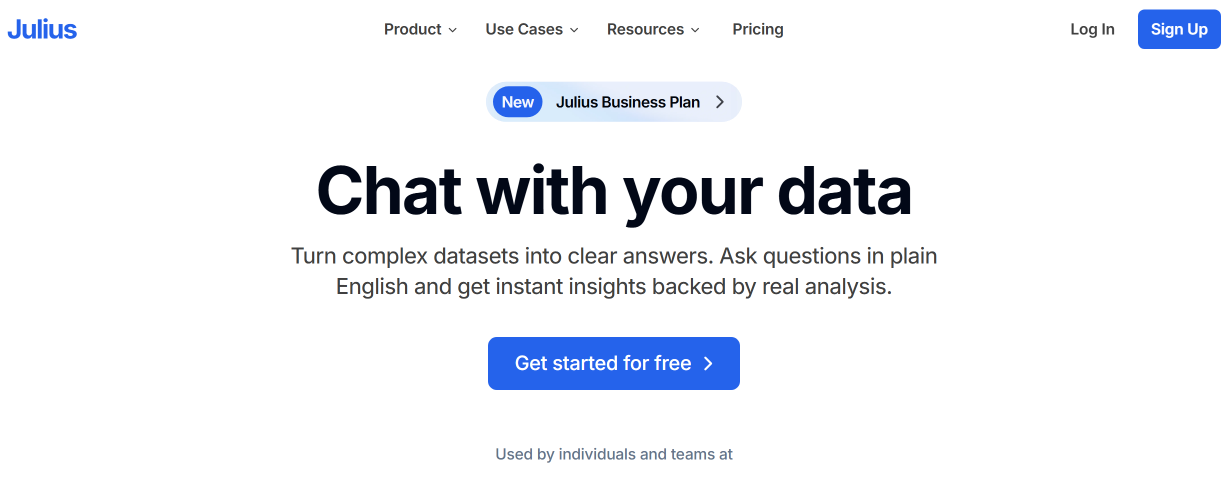
Source: julius.ai
The Julius AI platform is one of the best AI tools for data analysis in 2026. It uses artificial intelligence algorithms to analyze datasets, generate data-driven insights and visualizations, and automate reporting and other processes.
Key features:
- A user-friendly dialog interface allows users to ask questions about datasets loaded into the system in English and receive detailed answers. The platform automatically performs calculations, filtering, grouping, and modeling, without requiring knowledge of SQL or Python.
- Julius AI supports uploading data files in numerous formats, including CSV, Excel, PDF, Google Sheets, text files, images containing tables or other data.
- AI algorithms automatically visualize various types of data, converting them into line charts, scatterplots, histograms, and other visualizations. Visualization parameters can be customized through a dialog interface.
- The platform's AI business intelligence tools perform automated data analysis, generating insights and conclusions based on the results. Specifically, they can identify trends and anomalies, explain correlations, create brief summaries, generate formal reports for management, and more.
- Julius AI's advanced analytics capabilities include forecasting, regression and correlation analysis, predictive modeling, distribution analysis, among other tasks.
- Native database integrations (Snowflake, BigQuery, PostgreSQL, MySQL, Databricks, Google Drive, Google Ads, and others) help transfer data and manage workflows in real time.


Julius AI offers five pricing plans:
- Free: Daily updated free credits, support for CSV, XLSX, SAV formats, and Google Drive integration.
- Plus ($20/mo): 2,000 credits per month, access to advanced AI models, unlimited supported file formats, and unlimited charts.
- Pro ($45/mo): 5,000 credits per month, extended context window, and priority email support.
- Max ($200/mo): 25,000 credits per month, increased context window, early access to new features, and priority compute processing.
- Business ($450/mo): 60,000 credits per month, up to 50 team members, unlimited agents, and scheduled automated reports.
Microsoft Power BI
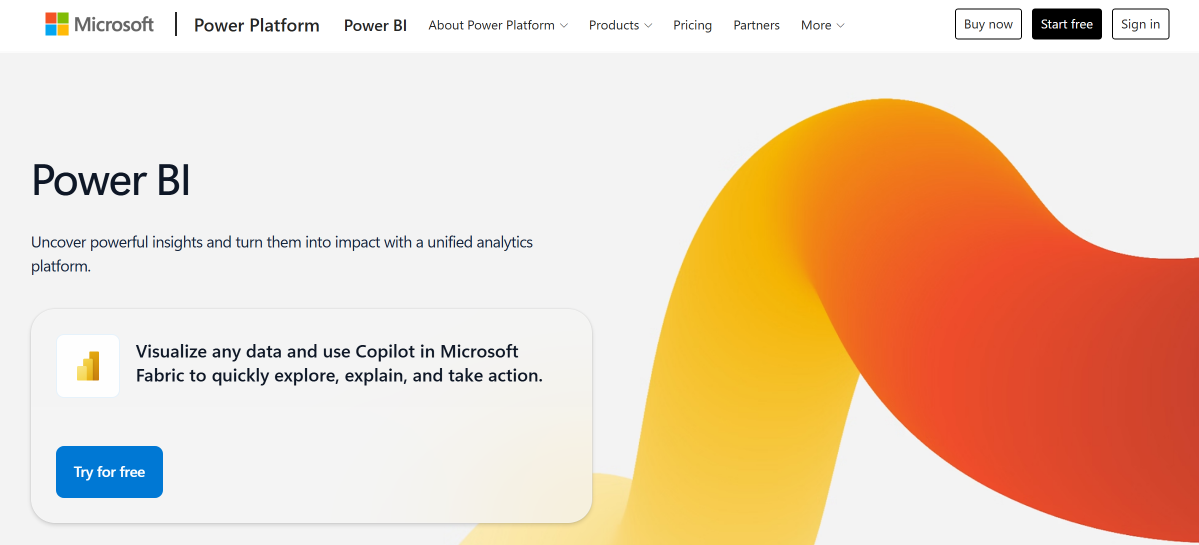
Source: microsoft.com
The Microsoft Power BI platform remains one of the leading AI tools for business insights. Thanks to the built-in Copilot AI assistant and its integration within the Microsoft Fabric ecosystem, users can analyze data, automate the generation of reports and summaries, and quickly gain data-driven insights directly within the conversational interface.
Key features:
- Based on text prompts, the platform automatically generates various types of reports and dashboards, including automatic visualization selection, KPI dashboards, layout generation, the creation of summaries based on reports, and other features.
- Microsoft Power BI can automatically analyze data and generate valuable insights. Its built-in AI Copilot identifies trends, anomalies, correlations, outliers, and performance changes, presenting them in analytical dashboards.
- Integration with the Microsoft Fabric ecosystem enables unified workflows, the creation of enterprise data lakes (OneLake), AI-driven pipelines and ETL, and end-to-end analytics.
- The AI assistant makes it easier and more convenient for users to work with data: instead of SQL or DAX formulas, they can submit text prompts in English. Copilot interprets the question, queries the semantic model for data, and automatically returns charts, summaries, or explanations.
- Copilot generates reports and dashboard summaries in a concise, informative style. This makes it easier for non-tech audiences to understand and apply the platform's generated results.
- Native integrations with Microsoft Teams, Excel, PowerPoint, and Outlook allow users to leverage Power BI's automated data visualization tools directly into their daily workflows.
Microsoft Power BI offers four main pricing options:
- Free: Included with free Microsoft Fabric accounts for personal report creation and dataset testing.
- Pro ($14/user/mo): Report publishing and sharing capabilities across organizations (included with Microsoft 365 E5).
- Premium Per User ($24/user/mo): All Pro features, plus advanced AI capabilities, larger dataset limits, and higher query refresh rates.
- Embedded (Price upon request): Automated deployment, custom report branding, and management for third-party applications.
Tableau Pulse
Source: tableau.com
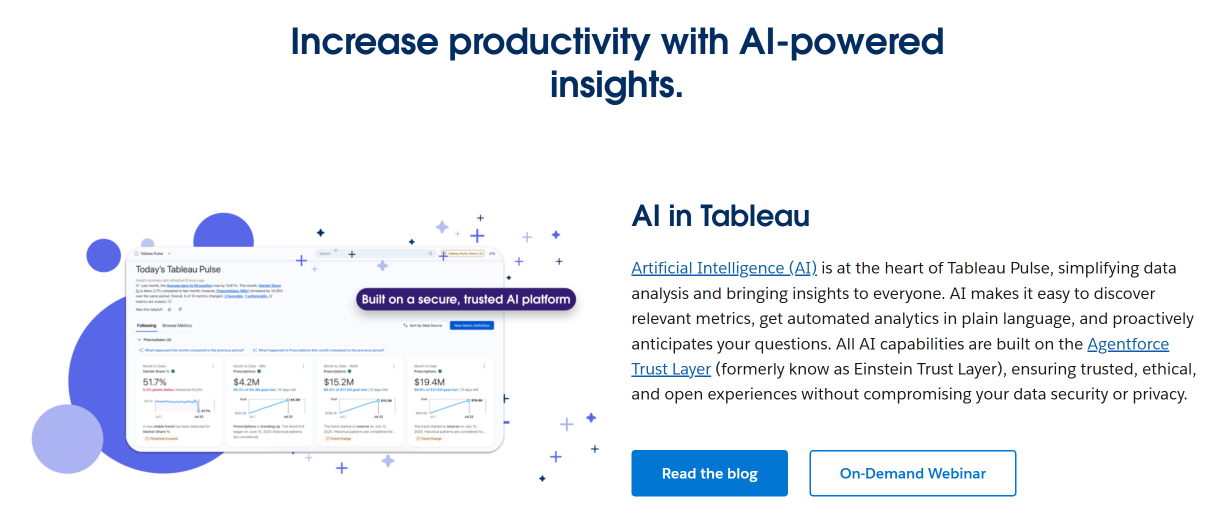
When choosing AI tools to clean and analyze data, it's worth considering the Tableau Pulse analytics platform by Salesforce. It provides analysts and business users with a powerful set of tools for monitoring KPIs and visualizing data, and integrations with Slack, Microsoft Teams, and other systems.
Key features:
- Tableau Pulse automatically identifies important data changes without requiring manual interaction with dashboards. Specifically, it tracks key business metrics, identifies trends and anomalies, generates comprehensive text summaries, and provides context-aware insights.
- The platform serves as a unified layer for monitoring key business metrics, performs consistent KPI calculations, and helps specialists manage information more easily and effectively.
- The dialog interface allows users to ask questions about data through text prompts instead of writing SQL queries or manually constructing charts. The system can simultaneously analyze multiple metrics, provide answers with source information, suggest additional questions, and generate auxiliary visualizations.
- Pulse's AI algorithms conduct comprehensive data analysis, identifying key factors, correlations between indicators, outliers, changes over different periods, etc., and provide insights into the identified trends and anomalies.
- The platform proactively informs users of important data updates by sending them notifications and alerts via Slack, Microsoft Teams, email, and the mobile app. It alerts users to detected anomalies, KPI changes, emerging trends, and more.
Tableau Pulse is included with Tableau Cloud subscriptions based on standard user roles:
- Viewer ($15/user/mo): Access to Tableau Pulse metrics, personalized digests, and automated KPI summaries.
- Explorer ($42/user/mo): Pulse features plus self-service data exploration and web content creation.
- Creator ($75/user/mo): Full Pulse analytics capabilities, end-to-end data prep (Tableau Prep), and desktop authoring.
- Tableau Enterprise / Cloud+ (Price upon request): Advanced AI extensions (Tableau Agent), enterprise data governance, and dedicated support.
ChatGPT
Source: chatgpt.com
Developed by OpenAI, ChatGPT functions as an end-to-end data analysis environment. Through Advanced Data Analysis (Code Interpreter), it executes Python code in real time to process raw files, run statistical models, and render dynamic charts.
Key features:
- The service supports uploading various types of data files, including CSV, Excel, PDF, JSON, text documents, images, graphs, data exported from SQL databases, and more.
- Users can ask questions and get answers about their data interactively, clean unstructured data, identify trends and anomalies, extract specific information from documents, and more.
- ChatGPT can independently execute Python code to solve complex analytical problems: statistical analysis, forecasting, regression models, time series analysis, clustering, etc.
- The chatbot effectively cleans data, preparing it for analysis. It handles missing values, normalizes formats, identifies inconsistent records, removes duplicates, reformats datasets, and merges tables.
- The service has data visualization capabilities, including the creation of line charts and histograms, scatter plots, heat maps, correlation matrices, and other types of visualizations.
- The chatbot's advanced analytical capabilities include correlation and cohort analysis, hypothesis testing, trend forecasting, risk analysis, scenario modeling, and more. Thanks to the Deep Research feature, the service can retrieve relevant market context through web search, improving the quality of results.
Pricing for ChatGPT includes four main plans:
- Free: Basic data analysis capabilities with access to standard reasoning models and limited file uploads.
- Plus ($20/mo): Expanded limits for file uploads, Python code execution, and access to flagship reasoning models.
- Pro (From $100 to $200/mo): Designed for heavy compute workflows, scaling access thresholds by up to 20x while offering elevated server bandwidth for massive datasets and deep analytical inquiries.
- Business & Enterprise: Tailored workspaces built around strict corporate compliance, administrative dashboards, and ironclad data privacy frameworks. Corporate groups can access standardized scaling from $20 per seat monthly (on an annual commitment), whereas large-scale organizational setups require bespoke contracts tailored to enterprise scale.
ThoughtSpot
Source: thoughtspot.com
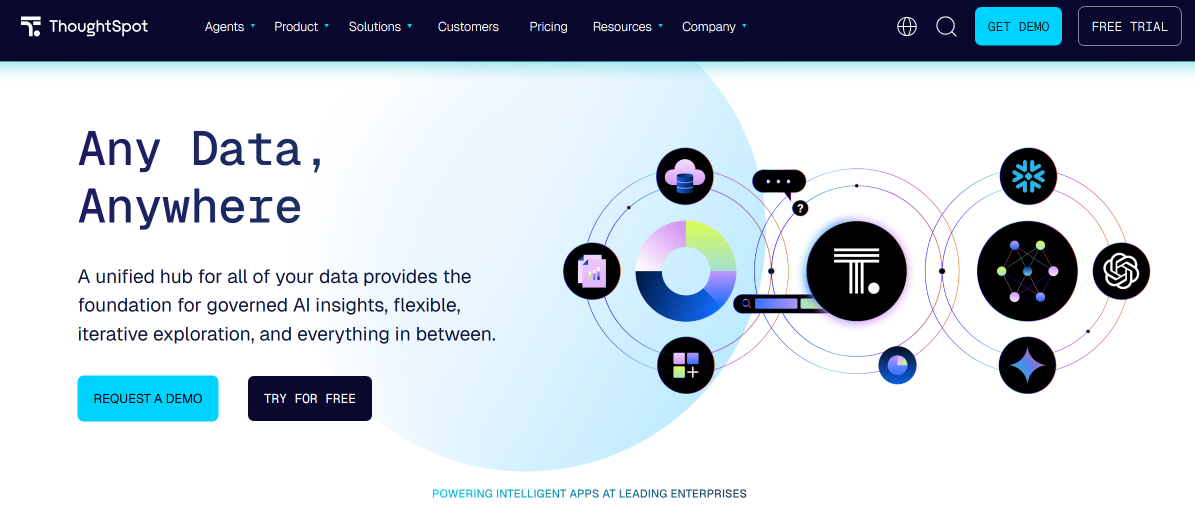
ThoughtSpot focuses on search-driven business intelligence, enabling non-technical business users to query enterprise cloud data warehouses using a search interface similar to web engines.
Key features:
- A search interface similar to Google’s allows users to formulate text queries in English and automatically generate analytical insights and charts based on them.
- Spotter, an AI assistant, provides detailed answers to questions about data, maintains and uses conversational context, generates detailed insights, investigates root causes, conducts cohort and trend analysis, and performs a range of other operations.
- Instead of traditional dashboards, ThoughtSpot uses interactive liveboards that update data in real time, provide interactive drill-down capabilities, KPI monitoring, dynamic filtering, segmentation, and more.
- Advanced analytics capabilities based on ML algorithms help the service identify trends and analyze anomalies, analyze KPI changes, generate forecasts, and send proactive alerts.
- ThoughtSpot supports native integrations with modern cloud data platforms: Snowflake, Databricks, Google BigQuery, Amazon Redshift, Microsoft Fabric, and more.
ThoughtSpot offers three pricing tiers based on usage and capacity:
- Essentials ($25/user/mo): Support for 5 to 50 users, up to 25 million data rows, and basic AI search features.
- Pro ($50/user/mo): Support for up to 1,000 users, up to 250 million rows, and advanced AI search analytics.
- Enterprise (Price upon request): Unlimited users, rows, custom security roles, and 24/7 dedicated enterprise support.
Conclusion
Choosing the right AI data analysis tool depends on your infrastructure and primary use case. For enterprise-wide dashboarding within existing cloud stacks, Microsoft Power BI and Tableau Pulse provide the deepest ecosystem integration. For ad-hoc dataset analysis and rapid Python-driven data exploration, Julius AI and ChatGPT offer the most flexible sandbox environments, while ThoughtSpot excels at bringing search-based reporting to non-technical business users.
Note: Pricing, plan limits, and feature availability can change over time. The details in this article were accurate when published, so be sure to check each platform’s official website for the most up-to-date information.